Cap-Image provides:
 |
Measurement
Functions for |
Blood Cell Velocity
Two different methods are
available for the velocity measurement:
a) Frame-to-Frame method
The
frame-to-frame method is generally taken to be the reference method for
measuring velocity in capillary microscopy. This method is time-consuming
but in some situations it is the only way to determine the blood cell
velocity. With Cap-Image the frame-to-frame method is rather comfortable
because the movement of blood cells is marked by clicking and dragging
using the mouse while the images are scrolled forwards or backwards step
by step. In doing so straight or curved lines are drawn along the way of
movement of the blood cells. The velocity is automatically calculated
using the geometric distance over which a blood cell has moved and the
time interval from frame to frame. This means that even continuous
measurements of the velocity in lengthy sequences can be made quickly and
easily.
b)
Line-Shift-Diagram method
The
Line-Shift-Diagram method is demonstrated with some screenshots from the
Cap-Image program. The first picture shows a venous blood vessel in the
mesentery of a mouse. Some leukocytes are visible in the vessel. In this
example four red parallel measurement lines are drawn for the measurement
of the leukocyte velocity. The measurement lines may be drawn straight or
curved and at any place and in any direction. For the evaluation of flow
chamber experiments parallel measurement line can be drawn over the entire
video image.
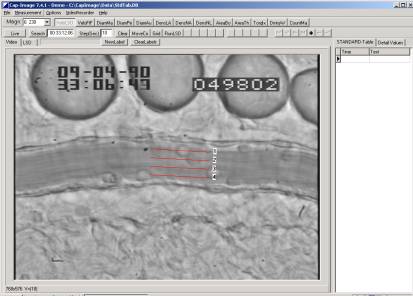
Pressing
the button �RunLSD� the video tape is started automatically and runs
for 10 seconds. Gray level data are collected during this measuring period
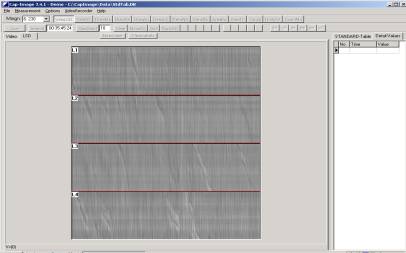
and then the so called �Line Shift Diagram� (LSD) is displayed, see
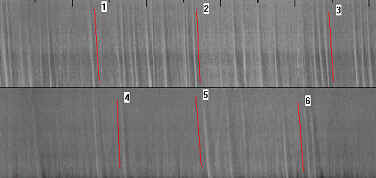
next picture. The Line Shift Diagram shows the grey levels which are
scanned along the four red measurement lines during the measuring period.
The x-axis shows the time (10 seconds) and the y-axes represent the length
of the measurement lines (L1 .. L4). Each leukocyte which has passed the
measurement line in the 10 sec time period has caused a angled structure
in this diagram. The velocity is calculated from the gradient of these
angled structures.
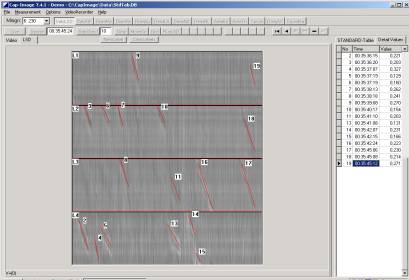
In
the Line Shift Diagram red angled lines are drawn along the angled
structures (see next picture) and for each of these lines the velocity
value (mm/s) is written into the table at the right side.
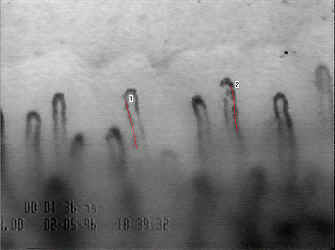
The
following two pictures show an example with human nailfold capillaries and
a Line Shift Diagram for that images.
The
LSD-method is a semi-automatic velocity measurement and does not depend on
the image quality or on the image contrast. Each movement of cells which
can be seen in the image causes angled lines which can be recognized in
the LSD. Reverse flow causes back slashes and zero velocity causes
horizontal lines in the LSD.
The
velocity measurement is limited in the upper end due to the video frame
rate. Therefore high speed video cameras with high frame rates should be
used for the measurement of high blood cell velocity.
Four
different methods are available for the capillary density measurement:
a) Functional capillary density
(length per area, mm/mm�)
In
a predefined measurement area (rectangle window or any shaped area) the perfused
capillaries are traced using the mouse. The functional capillary
density
is calculated as the total length of the drawn capillary lines divided by
the measurement area.
b)
Number per area
In
a predefined measurement area (rectangle window or any shaped area) the
capillaries are counted by setting a mouse click for each capillary. The
capillary density is the total number of clicked points divided by the
measurement area.
c)
Number per cylinder volume
In
a predefined rectangle measurement area the capillaries are counted by
setting a mouse click for each capillary. The capillary density is the
total number of clicked points divided by the volume of the cylinder whose
diameter and length are defined by the measurement area.
d)
Number per length
Along
a predefined measurement line the capillaries are counted by setting a
mouse click for each capillary. The capillary density is the total number
of clicked points divided by the length of measurement line.
The
capillary diameters can be measured either manually or automatically. For
the manual method there are two variants - on the one hand the diameter is
measured directly by setting the distance by two mouse clicks on the other
by clicking three points, from which the system automatically calculates
the perpendicular distance to the course of the vessel.
With the automatic method there are several processes
which can be adjusted to the relevant image conditions using various
parameters. It is also possible to take measurements at several places
simultaneously and also continuously over any length of time.
Vasomotion
Using
the automatic capillary diameter measurement as described in the paragraph
before the vasomotion of capillaries can be acquired as the variation of
diameter over the time.
The geometric area of
quadrangles, polygons and
regions of any shape can be measured. Also the average, minimal and
maximum grey level within the measured area is calculated.
Leukocyte
Adhesion
For
the quantification of the leukocyte adhesion the velocity of leukocytes should be determined using the LSD
method. Cells which adhere several times generate steps in the line shift
diagram. Stickers generate long horizontal lines. From the table
containing the measurement values for velocity and adherence duration of
each leukocyte an Excel bar chart can be created. The classes of the bar
chart are defined in a paramater window.
Torquation
Index
The
torquation index is a measure for the torquation
of nailfold capillaries. It is determined by scanning the capillary with
short straight line segments and it is calculated from the total sum of
all angles which are formed from the line segments scanning the capillary
minus 180� divided by 90�, i.e. a normal capillary with a 180� loop is
not torquated and has the torquation index 0.
Tortuosity
The
tortuosity of capillaries can also be quantified by drawing the winding
line of the capillary. Then the straight connecting line from the starting
point to the endpoint of the winding line is automatically drawn and the
ratio "Length of the winding line" divided by "Length
of the straight line" is calculated.
Densitometry
(Permeability Measurement)
The mean grey level in rectangular windows is
measured. Up to four windows can be defined. Time intervals can be
specified for sequential measurements in the defined windows, in order to
measure the changes of
brightness during a measurement period. For a sequence of measurement
first an initial value must be determined. This initial value is taken as
100%. Each succeeding value in the sequence is calculated as the
percentage from the initial value, e.g. when the brightness decreases 10%
then the result is 90 or when the brightness increases 10% then the result
is 110. Corresponding to the predefined measurement intervals the video
tape is automatically wound forwards each interval and the measurement is
performed automatically until the last interval is finished.
Cell
Counting
Blood
cells which pass through a vessel within a predefined period of time can
be counted by the user with manual mouse clicks, in other words the user
must press the mouse button every time a blood cell passes the vessel.
After the elapse of the predefined counting time, the video recorder is
stopped and the number of counted cells per unit of time is calculated.
During the counting process the speed of the recorder may be altered or
even reversed. The counting time is nevertheless measured correctly since
it is determined by counting the number of video frames. The counting is
terminated when the stop time code on the tape is reached.
Real
Time Movement
Correction
In some measurement functions the automatic real time
movement correction can be activated. A region can be marked by setting a
cross and a rectangular window. The automatic movement correction searches
the image pattern at the cross within the window and moves the window to
the new position if necessary. The same shift is done with the measurement
lines and measurement windows such keeping them at the right position when
the image is moving.
In
case of frame to frame velocity measurement the movement can be corrected
manually by dragging the cross to the right position if the automatic
movement correction is not successful.
Computer
Controlled Video Recorder
If a video recorder
/ DVD recorder is connected to the PC via the
RS-232 interface (COM1) Cap-Image can remote control the video recorder,
for example, when selecting the LIVE button, the recorder is set to PLAY
and when selecting FREEZE, the recorder is set to PAUSE. The video tape
can also be positioned on a certain frame number or on a certain time code.
It is also possible to step forwards or backwards by a defined interval.
|